Analyzing Geography Data (Beginners' Tutorial)
数据来源
卫星类型
-
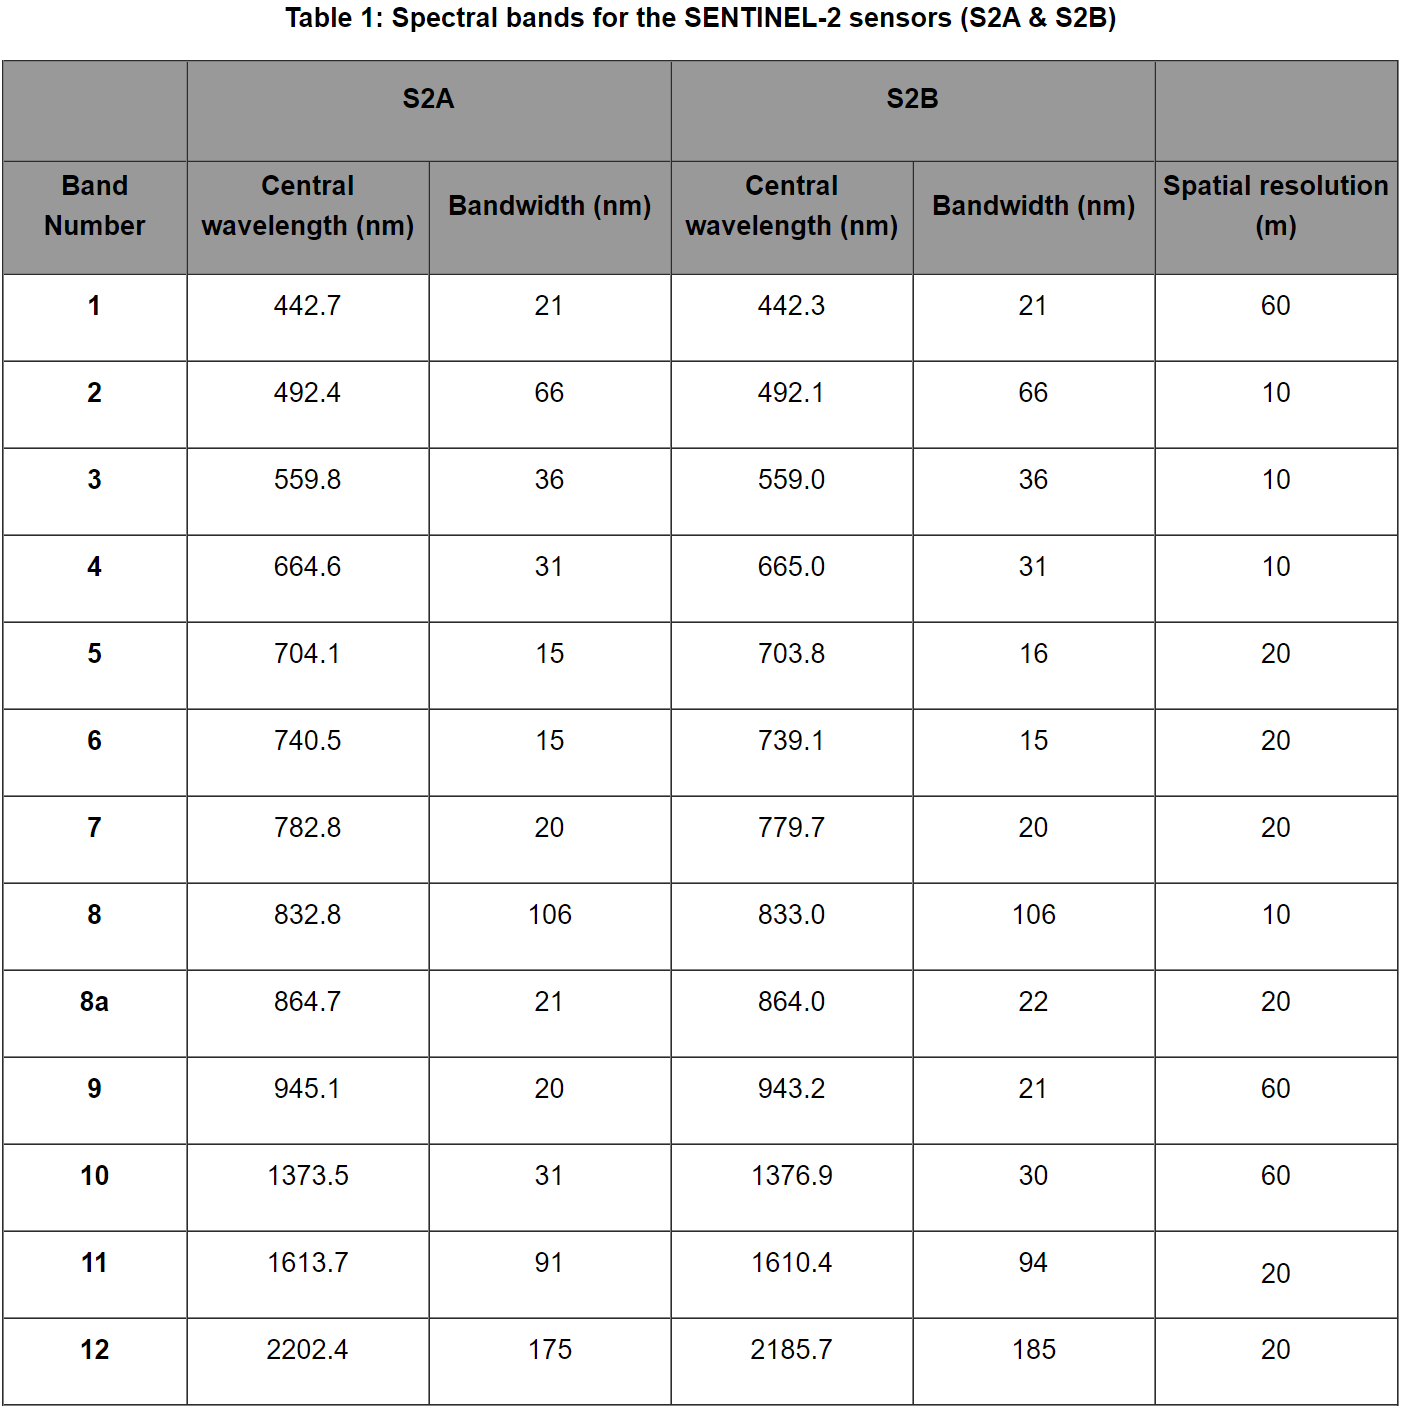
Sentinel-2:提供混合分辨率的13 Bands MSI。分辨率有,,,bands中心波长从442.3nm到2185.7nm。
![image-20201213154533413]()
-
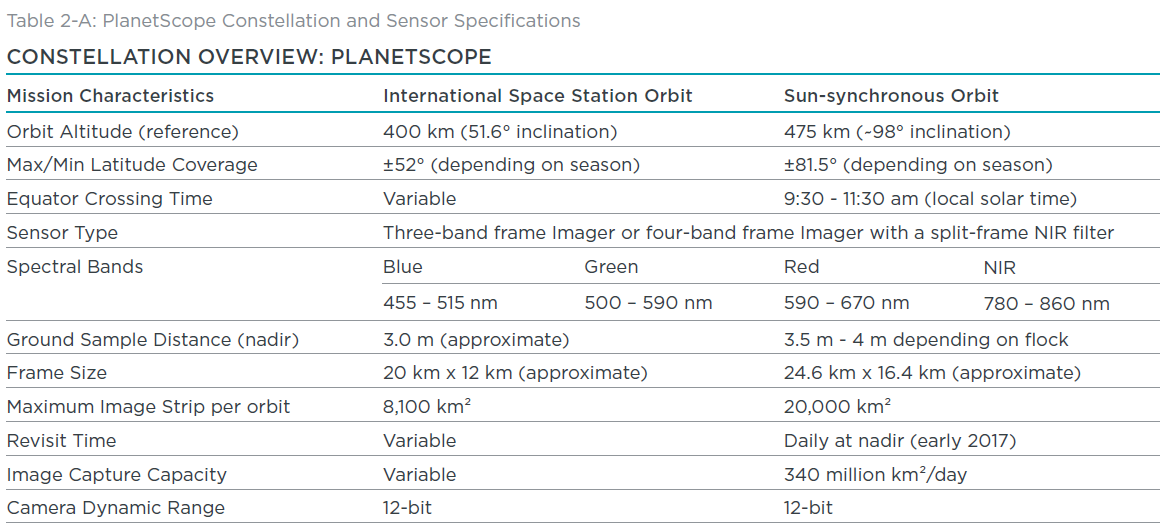
Planet:这个数据源提供的4 bands MSI image。分别是R、G、B、NIR。
- 这个数据源似乎只对美国国内的院校机构开放,不过不是很确定,需要的可以试试。
![Planet Specification]()
-
RapidEyes
Sentinel-2 Data Source
-
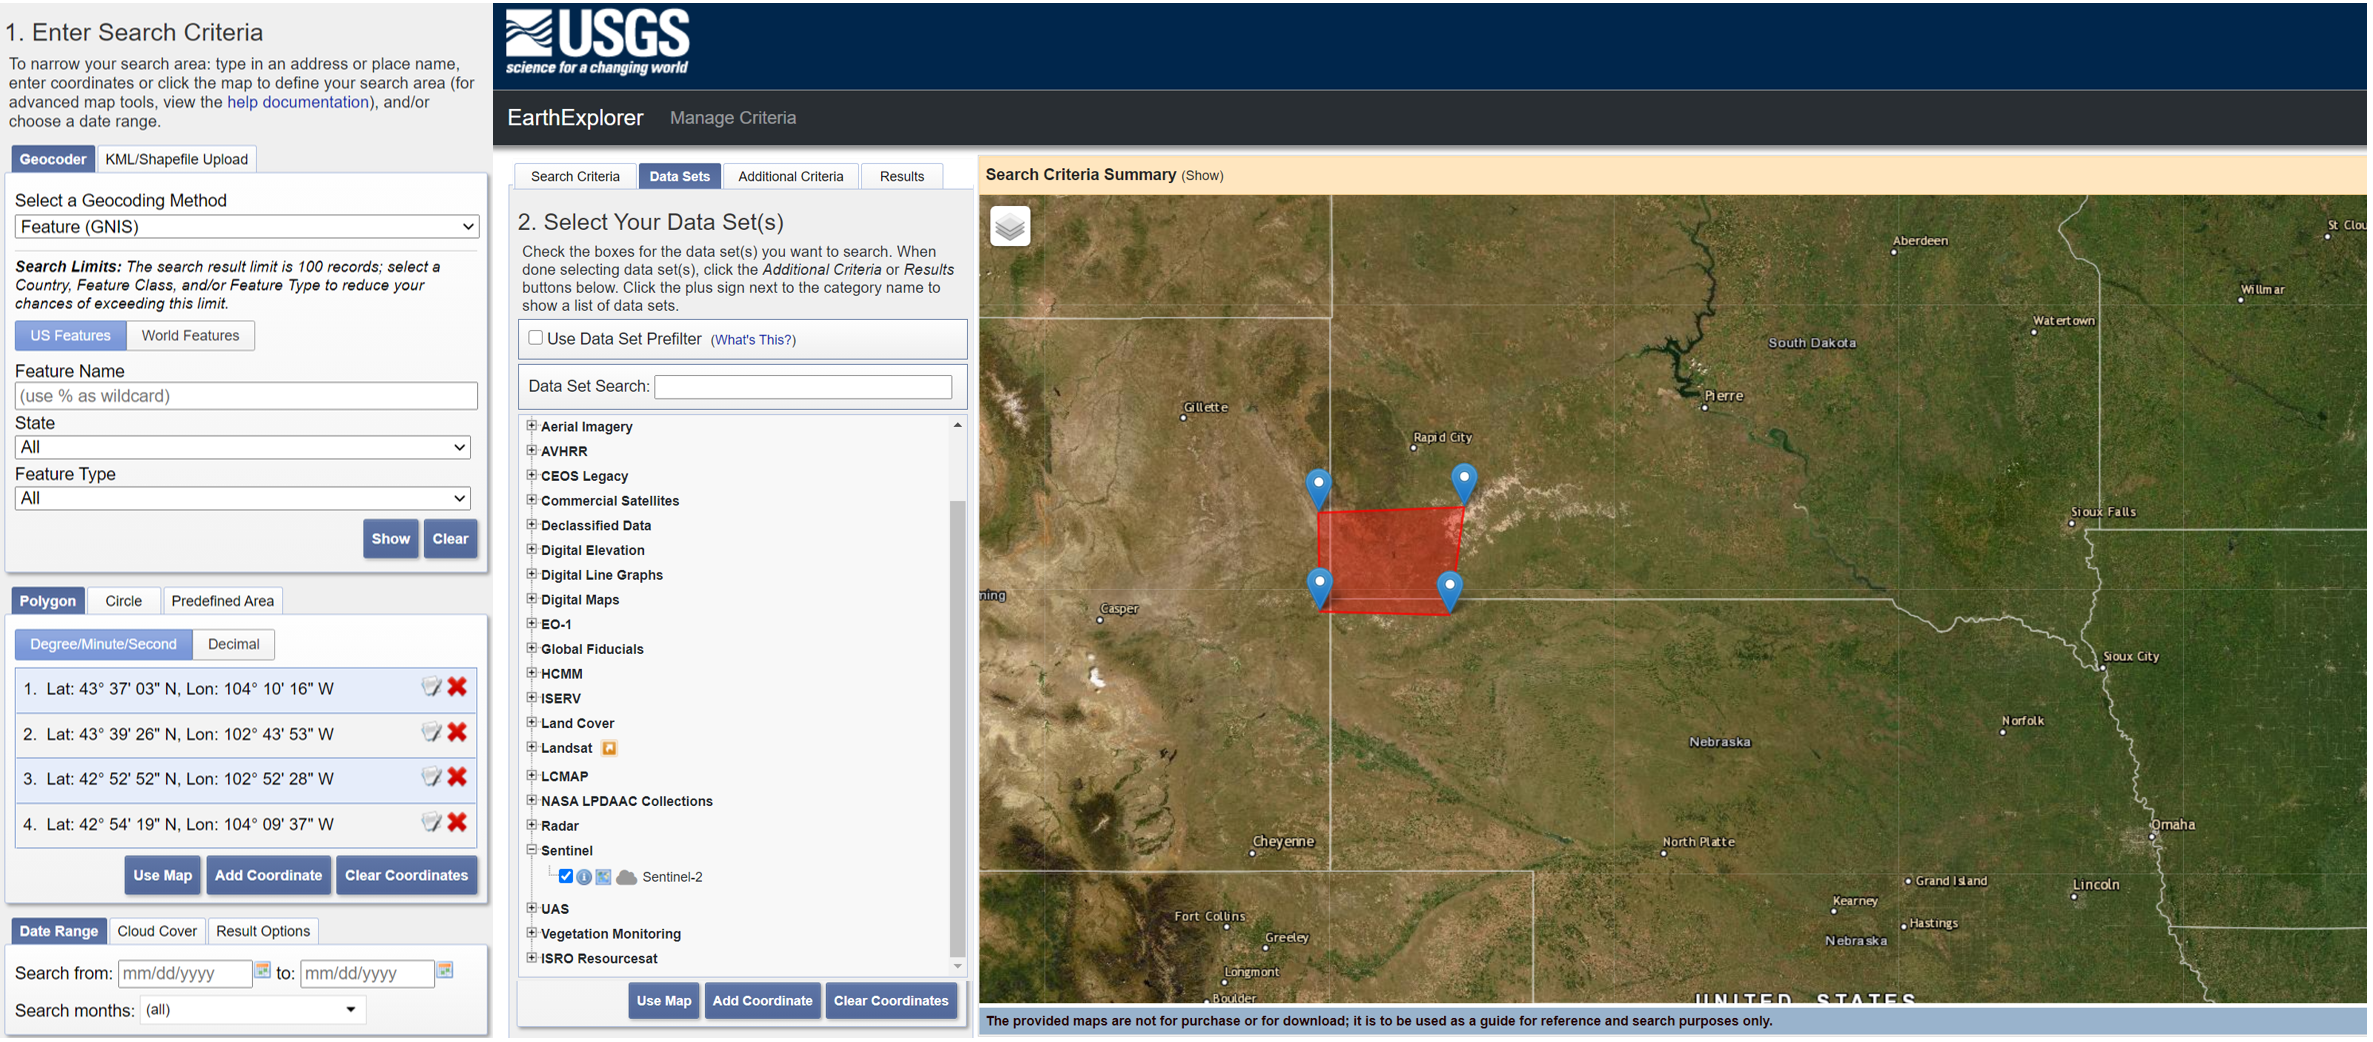
USGS Earth Explorer: Link. It support downloading data within five years. And it not only support sentinel-2 data, but also contains many other satellite datasource.
![image-20201227143234319]()
-
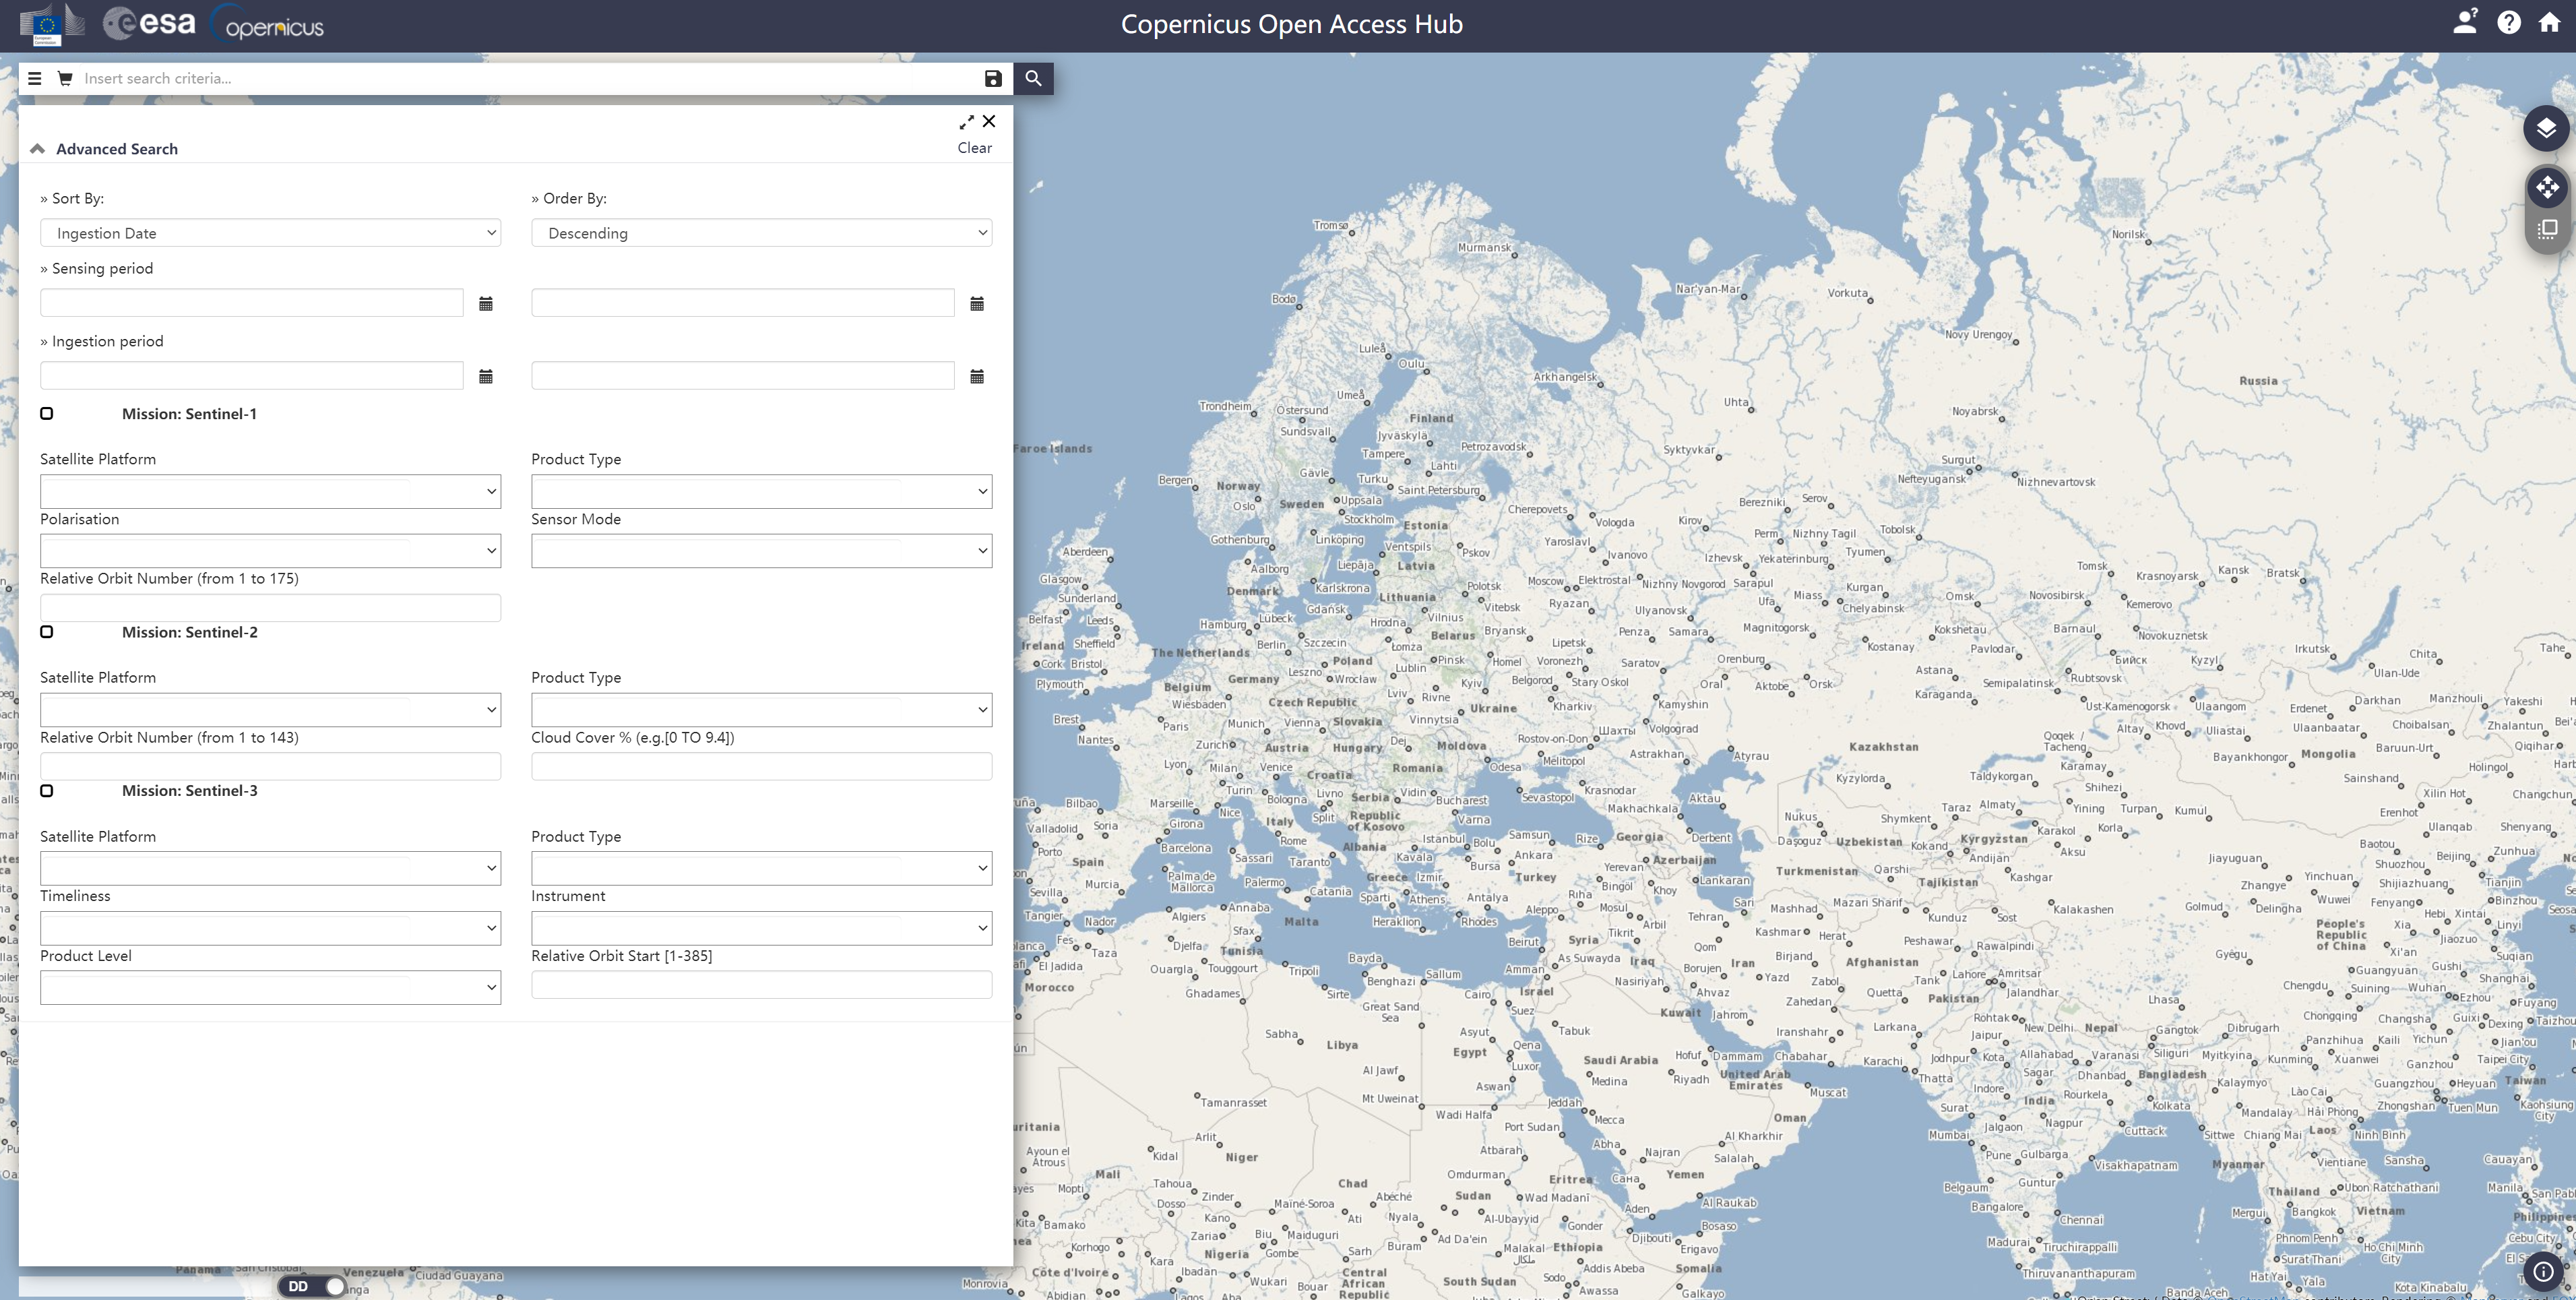
Copernicus Open Access Hub: Link. It supports only one year’s old data. You can request the older data, but not guarante the fetch time.
![image-20201227145324164]()
-
Amazon AWS Sentinel-2 Service: Link
Planet Data Source
- 官网:Link
Specification
- Sentinel-2 MultiSpectral Instrument (MSI) Overview
- Sentinel-2 Specification Doc
- Planet Specification
软件与Python包简介
- GDAL –> Fundamental package for processing vector and raster data formats (many modules below depend on this). Used for raster processing.
- Rasterio –> Clean and fast and geospatial raster I/O for Python. Guidebook.
- Geopandas –> Working with geospatial data in Python made easier, combines the capabilities of pandas and shapely.
- Shapely –> Python package for manipulation and analysis of planar geometric objects (based on widely deployed GEOS).
- Fiona –> Reading and writing spatial data (alternative for geopandas).
- Pyproj –> Performs cartographic transformations and geodetic computations (based on PROJ.4).
- Pysal –> Library of spatial analysis functions written in Python.
- Geopy –> Geocoding library: coordinates to address <-> address to coordinates.
- GeoViews –> Interactive Maps for the web.
- Networkx –> Network analysis and routing in Python (e.g. Dijkstra and A* -algorithms), see this post.
- Cartopy –> Make drawing maps for data analysis and visualisation as easy as possible.
- Scipy.spatial –> Spatial algorithms and data structures.
- Rtree –> Spatial indexing for Python for quick spatial lookups.
- RSGISLib –> Remote Sensing and GIS Software Library for Python.
- python-geojson-> Deal with geojson format files.
Sentinel-2 大气校正
Sentinel-2一般有两种standard,一个是A级别,一个是C级别。C级别的数据是你可以从任意网站上下载到的数据,它没有经过大气校正,是粗数据,每个区块的反射率可能有不同,不适合直接用作深度学习数据。
经过Sen2Cor软件校正后可以得到A级别的数据。
Sen2Cor是欧空局发布的一个软件,它即可以作为SNAP的插件安装,也可以作为独立命令行软件使用。推荐后者,更为快速、稳定,尤其适用于大量数据时,可以用脚本批处理。官网链接
查询坐标映射
- 地球是圆的。
- 卫星上拍的一张矩形照片所对应的区域并非是矩形的。
- 使用卫星图片时要先将其映射到二维展开的坐标系中。
- 整个地球被分为了许多预先订好的区域。
- 每个区域有一个编号。
- 编号可以在EPSG网站查询。
SNAP
-
欧空局自己用作处理Sentinel-2的软件。Link
-
只用来处理Sentinel-2,尤其是预处理,包括校正,reprojection,粗crop,统一各个bands分辨率等等,非常好用。因为是亲儿子,所以甚至可以直接读取Sentinel-2每个文件的压缩包,总之十分便利。
-
比较古老,interface有年代感,功能也相较于其他软件比较局限。
-
推荐用作第一步预处理。
-
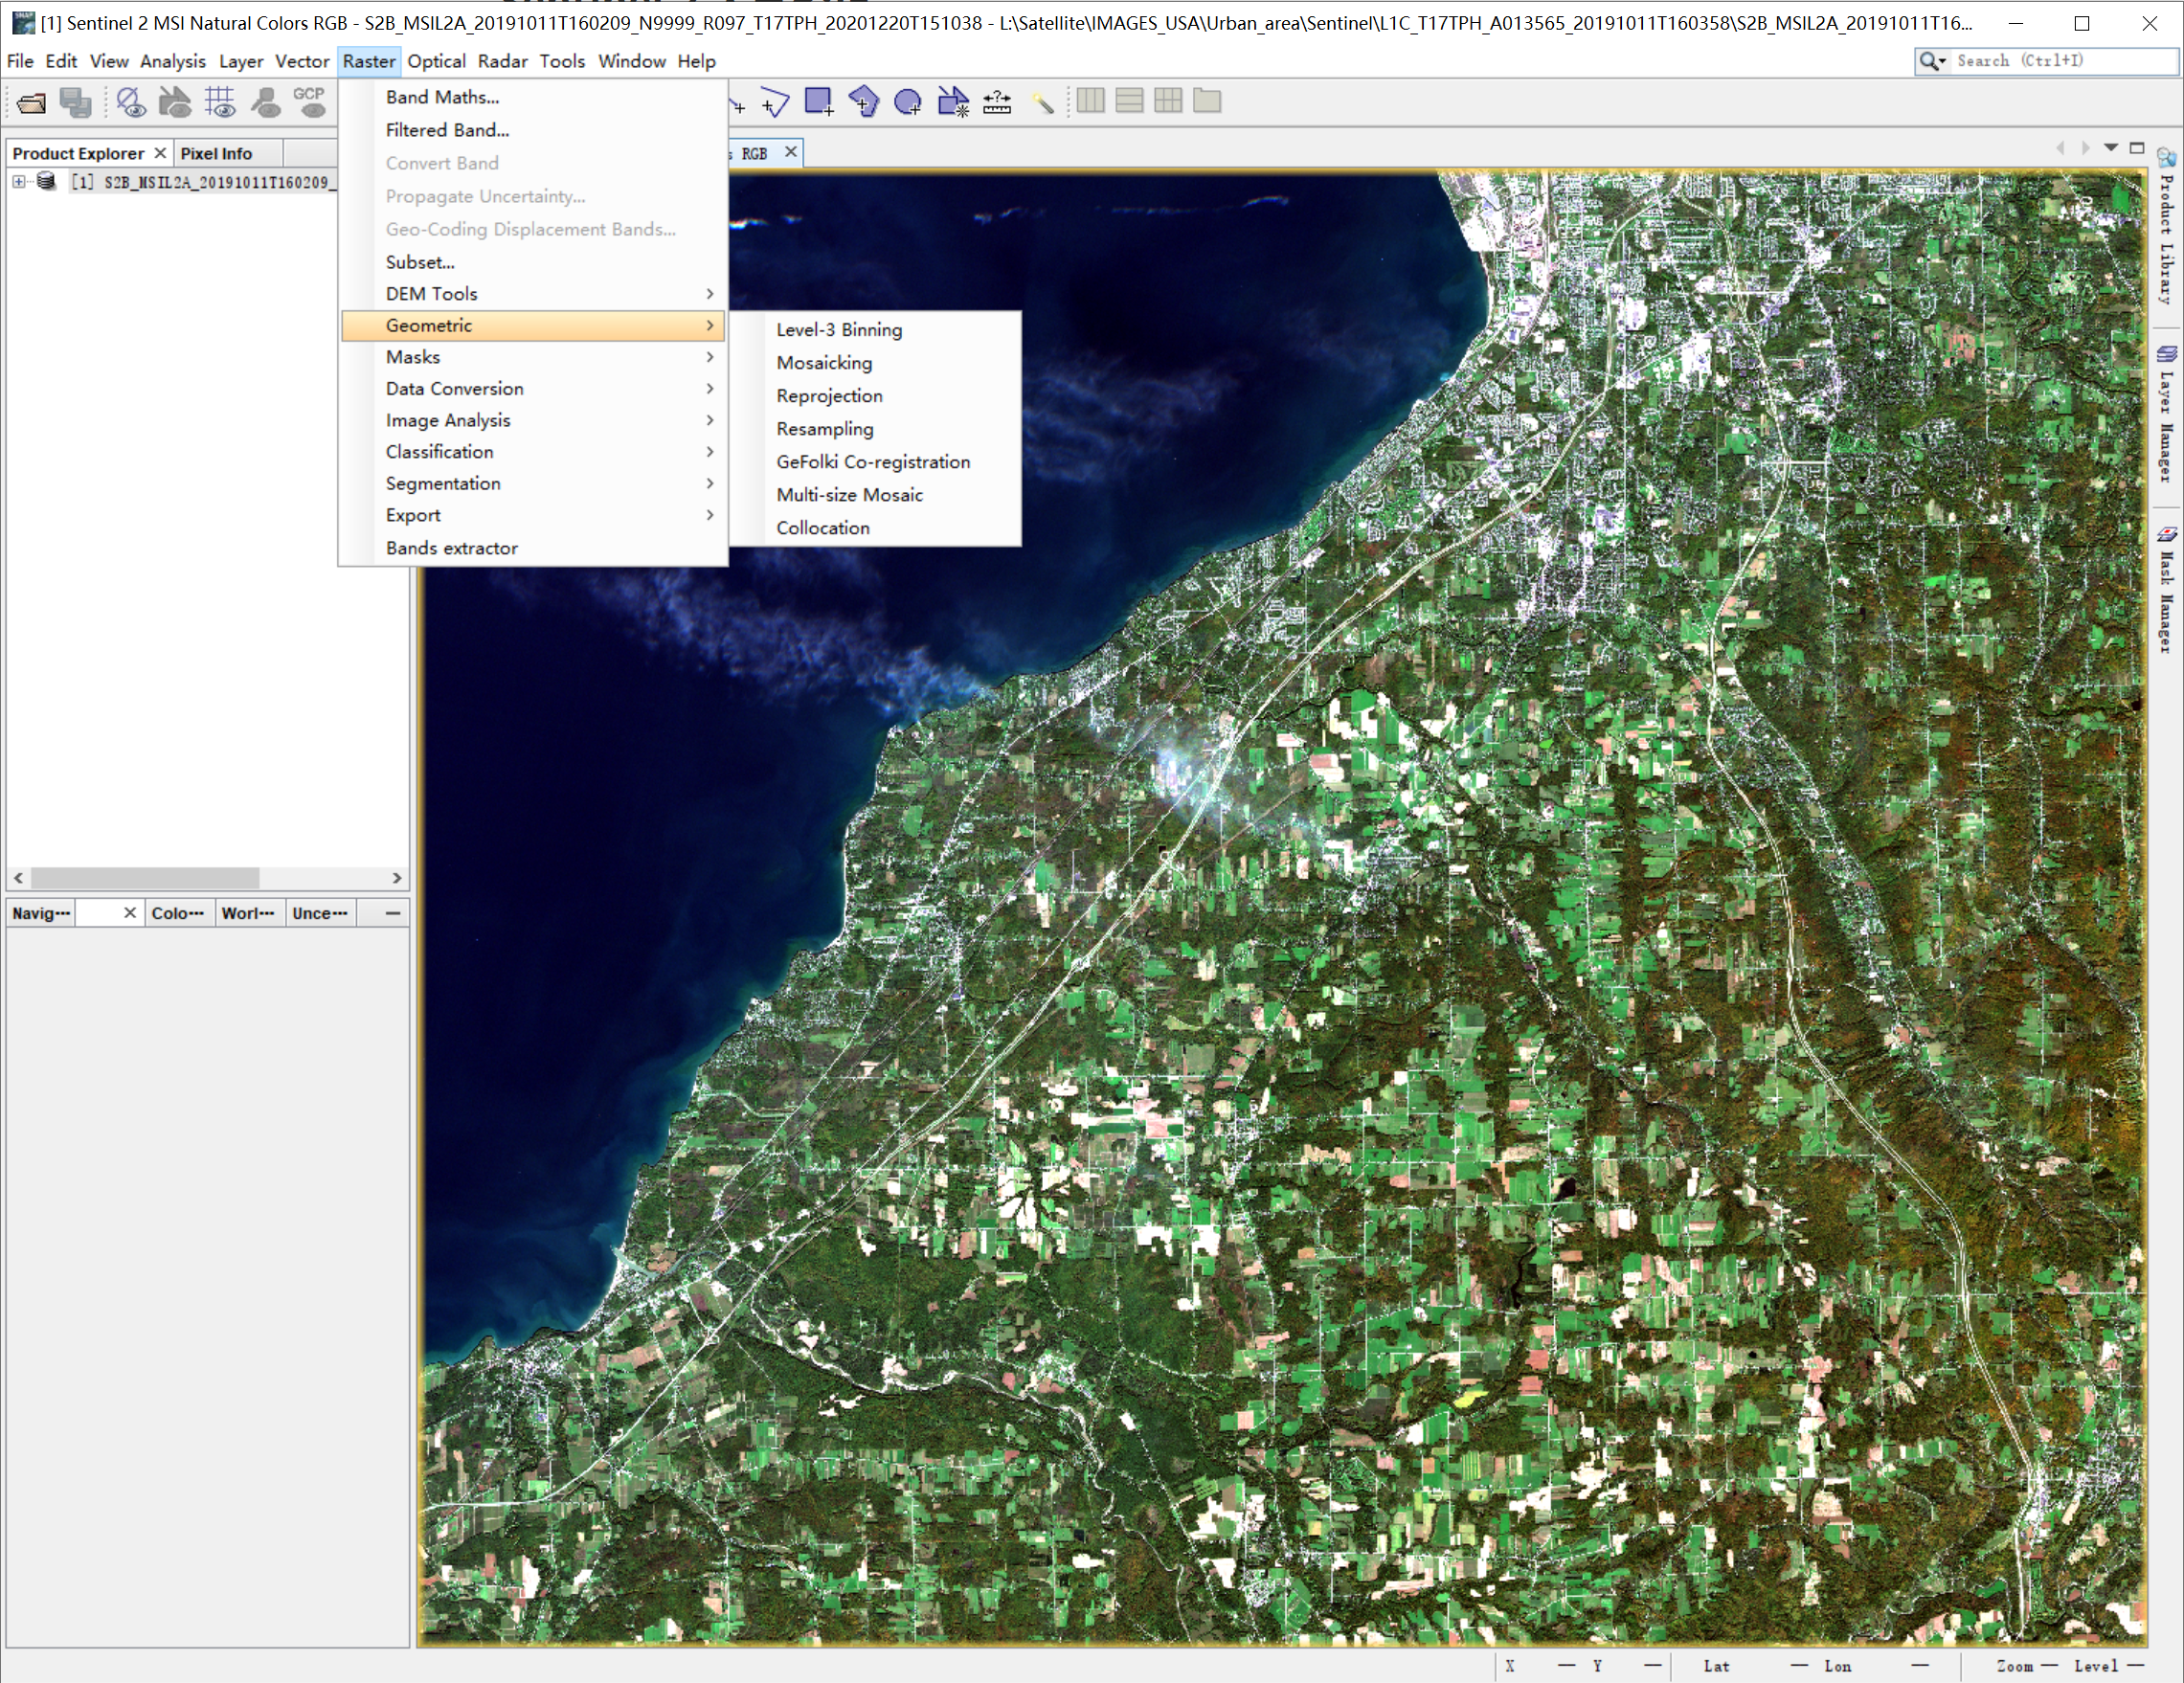
使用流程:
读取->剪裁->correction->resize->reprojection->导出。 -
大部分需要用到的功能都在
Raster->Geometric中 -
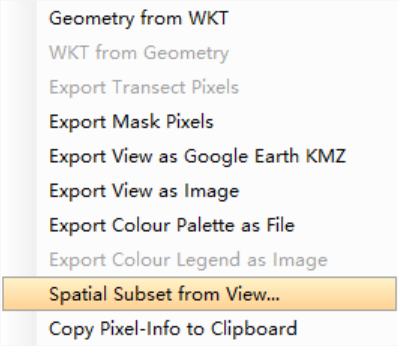
经过尝试、搜索、确认,SNAP并不提供便利的选定区域截图,或是依据shapefile剪裁,所以目前最佳的方法是,先通过zoom地图和改变窗口大小确保需要的部分大致在view的可视范围内,然后右键,选择
Spatial Subset from View,然后可视区域即可被剪裁。注意,这只是粗剪裁,所以尽量多包括一点,也不要少任何一部分。剪裁后的内容可以后续在ArcGIS Pro中进一步处理。![image-20201227155911702]()
-
展示图:
![image-20201227155421761]()
![image-20201227155558109]()
ArcGIS Pro
-
我能找到的最强大的可用于卫星图像处理的软件。
-
专业,美观,支持format多,有着强大的raster functions。
-
版权软件,下载之前先确认自己学校或公司是否提供License。
-
有时导出raster会出现随机bug,导致:导出可能是纯黑的图片,导出部分没有按照期望剪裁等。很恶心,但似乎也没有更好的选择。
-
解决导出问题:
- 关闭导出窗口,重新操作,多试几次。可以解决绝大部分问题。
- 和剪裁、mask等有关的问题可以先使用raster function进行这些操作,再直接导出前面操作的结果layer。
-
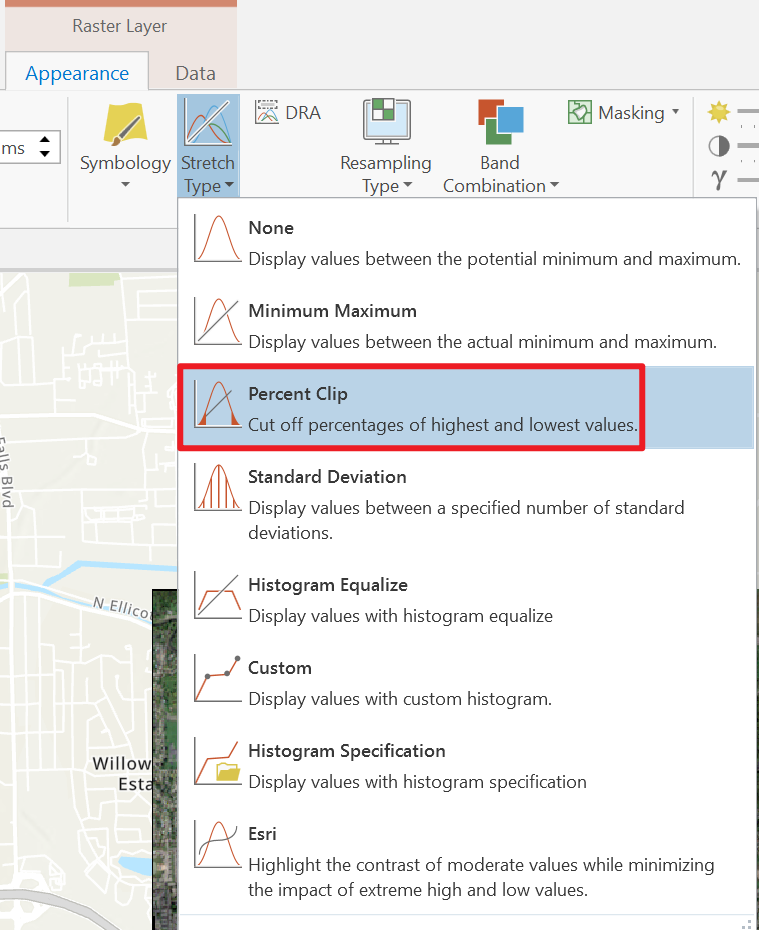
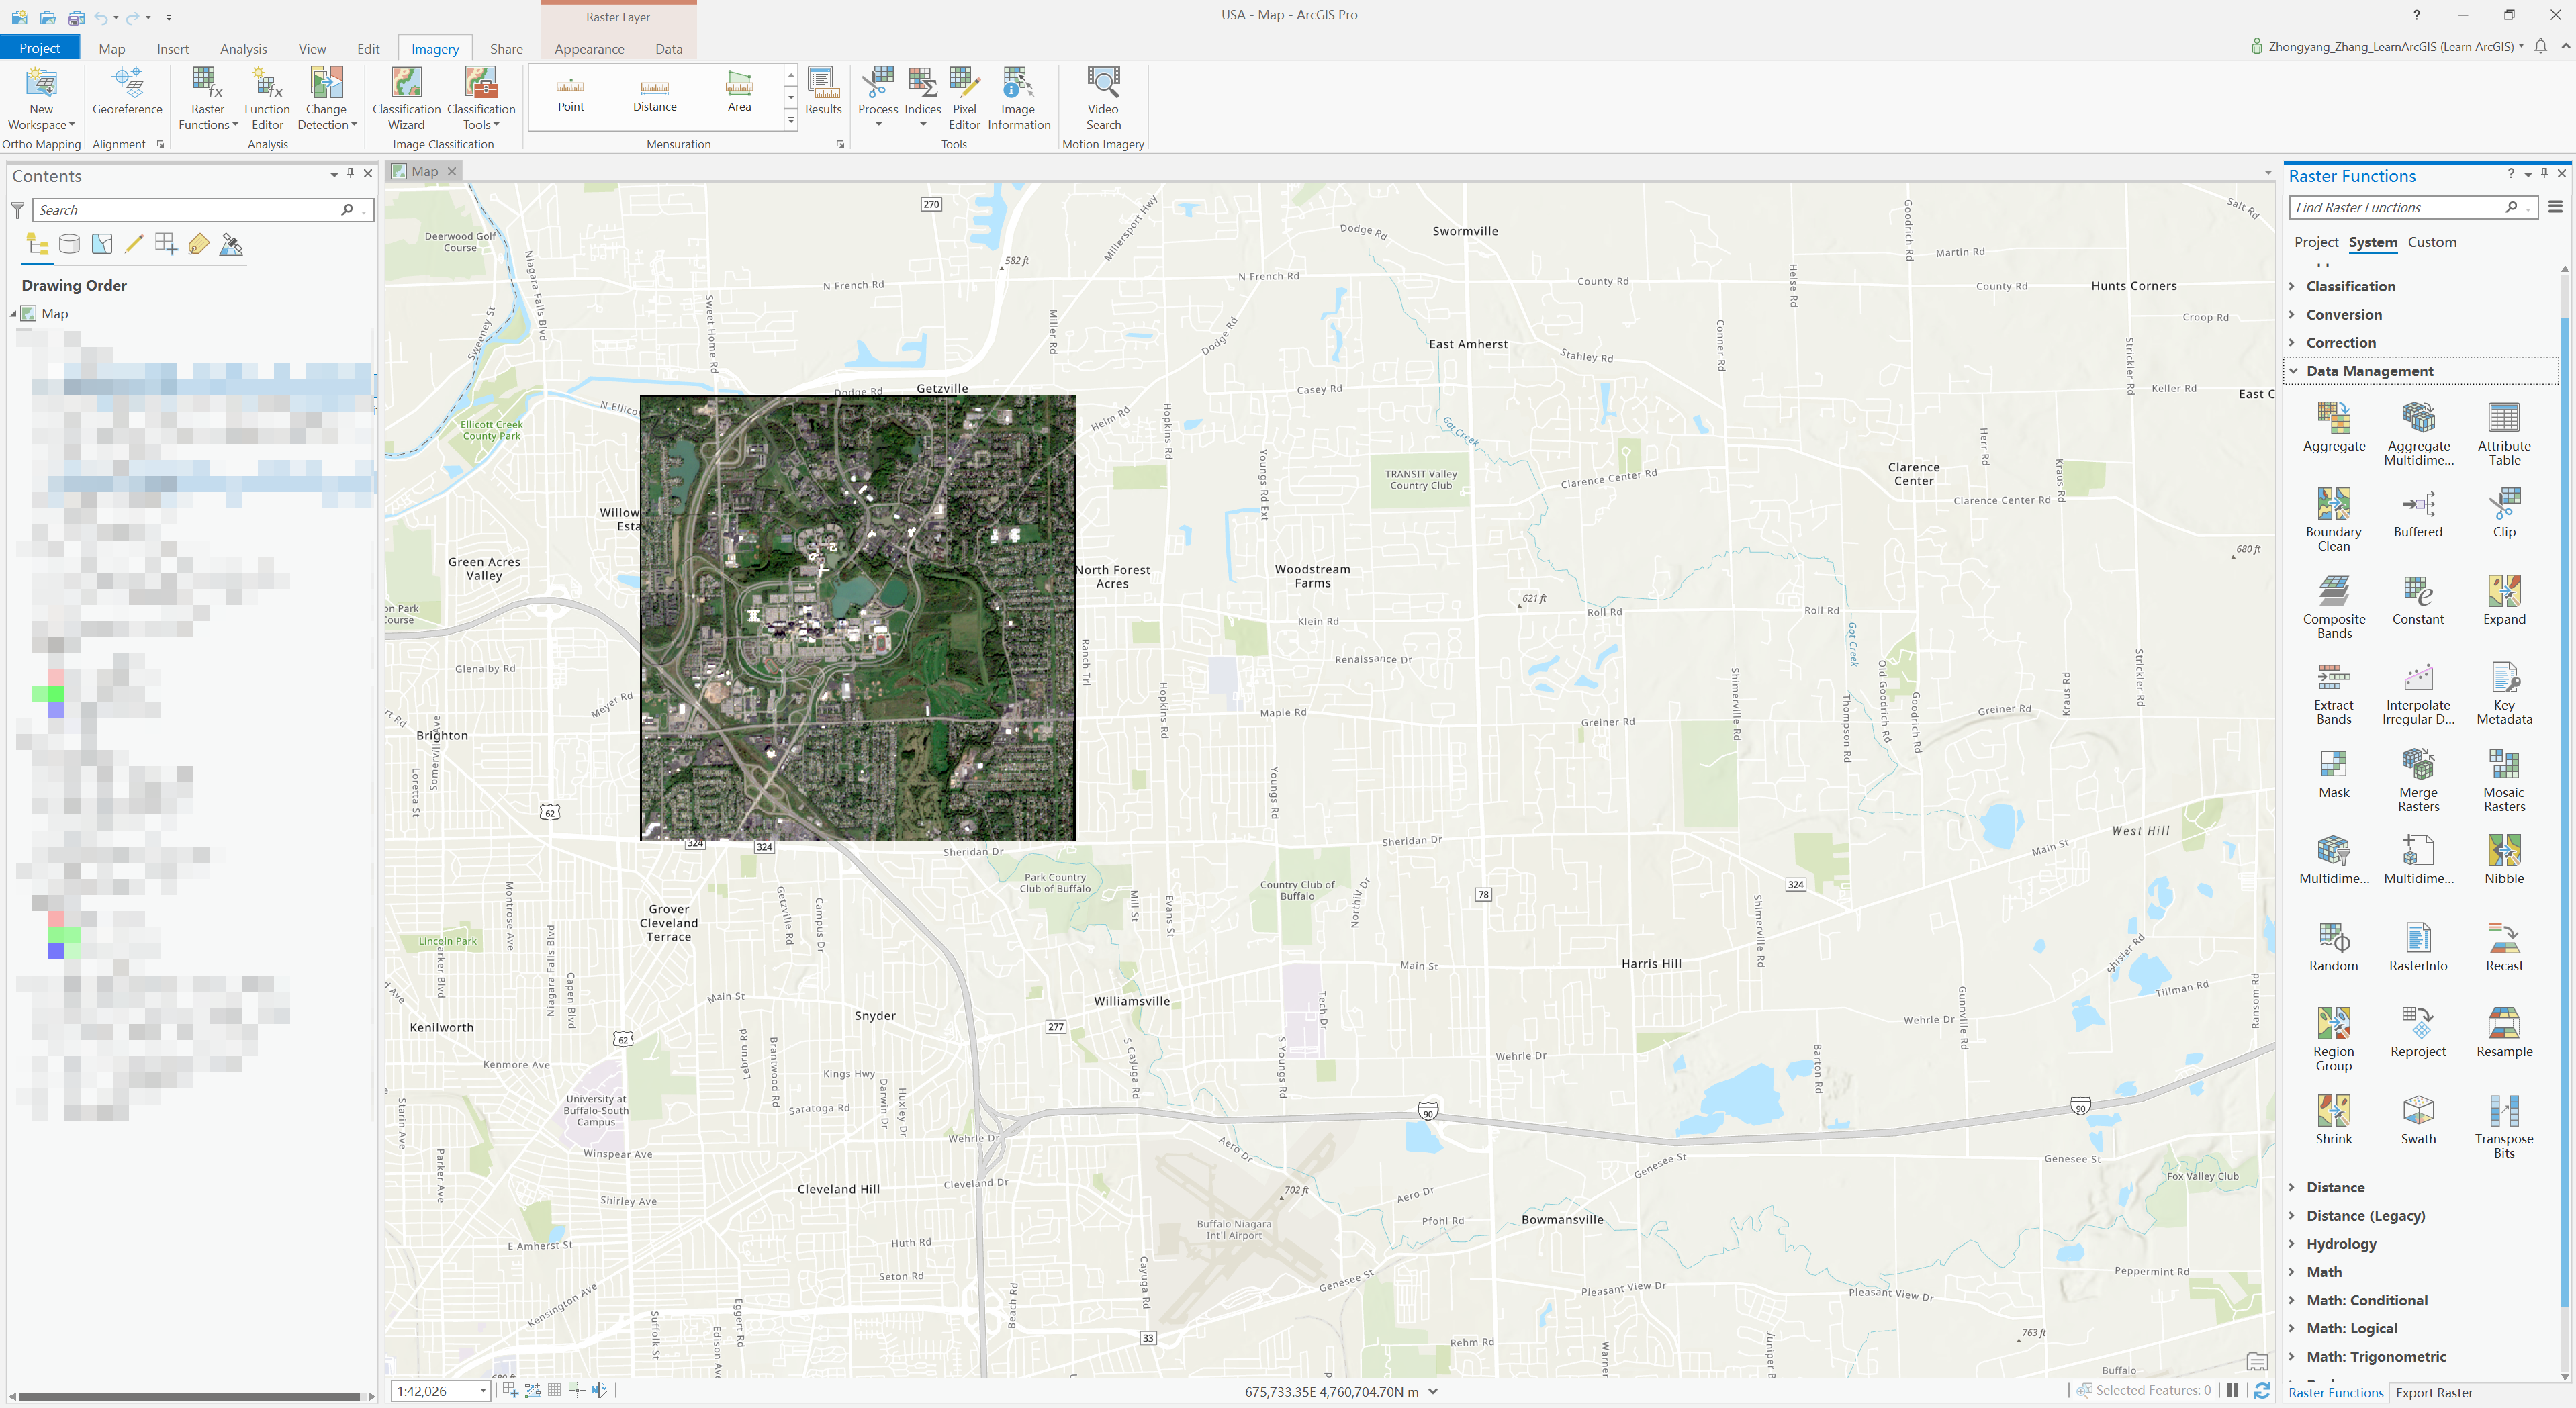
关于剪裁后的卫星图片和原始图片有着明显亮度对比度区别的问题:
-
首先,这不是一个bug,而是一个feature。。。实际上的卫星图都很暗沉的,所以软件原生提供一个“显示方法”的函数,调整图片曲线,使得显示的图片比较亮,容易看清楚细节。然而,剪裁后的图片有着不一样的统计值,所以在有些显示函数下,显示的结果和剪裁前结果不同。
![image-20201227155342029]()
-
但是不用担心,因为导出时候并不会考虑这个显示函数。即:剪裁前后的导出图像数值是相同的。
-
-
下面是两张展示图:
QGIS
-
开源软件,支持很多插件,比如直接下载Sentinel-2数据,Sen2Cor等。Link
-
支持很多format的数据。
-
问题是,不稳定,效率低,容易崩溃(软件&心态),甚至左侧Explorer遇到大文件夹都要经常转很久才能进去,或是干脆就直接转崩了。我怀疑他们要分析每个文件夹所有文件之后再显示列表。。。总之,慎重。
![image-20201227160344273]()

Pythonic Method
虽然前面介绍了几个软件,但是说实话,处理一两个可以,批量处理几十几百甚至几十万就有点力不从心了。所以最后还是狠下心研究了一遍Python处理这些数据的方法,写出了一批适合我项目用的函数。不一定适合所有人,但可以作为参考:
1 | import numpy as np |